


Housing prices far outpace incomes -- even in smaller U.S. cities now
Restless Project, the pandemic edition

Americans are mad. They feel like they're getting ripped off all the time -- I've made a career chronicling this -- but I don't think they are quite sure who to be mad at. There's a long list of culprits, but here's one that's often overlooked. Even people with good jobs can't afford good homes in most U.S. cities. That's....insane. It makes no sense economically, and it's certainly "crazy-making." For decades, there's been a huge gap between income growth and home price increases and that has put many young families into impossible situations. I saw new data demonstrating this gap recently -- and worse yet, showing the gap widened dramatically during the pandemic -- so it's time for me to dust off the old Restless Project.
Here's the basics: To really afford an average home in America today, families need an income of about $145,000. Current median household income is actually about $70,000. Punishing math. That's one reason everyone is so mad.
Beneath those numbers, here's another punishing reality. Median-priced homes in America now cost more than 5 times median annual salaries. A generation or so ago, homes cost roughly 3 times annual salaries. That's punishing math. No amount of skimping on morning lattes can make up for that.
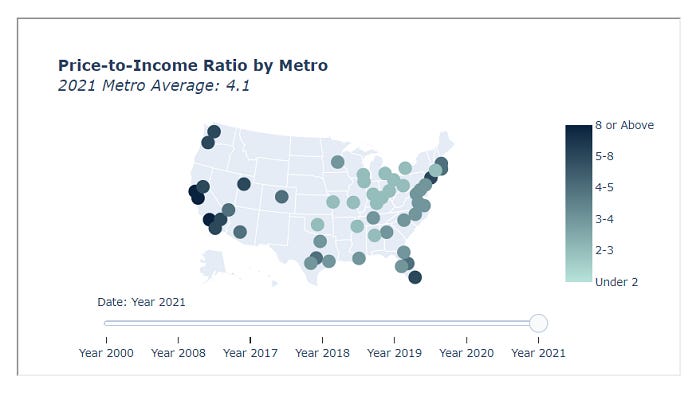
Here are a few other ways to describe the problem, from Clever, a real estate data company.
"We found that since 1965, average home values have skyrocketed from $171,942 to $374,900 — a 118% increase. Meanwhile, median household income crept up just 15%, from $59,920 to $69,178 in 2021-inflation-adjusted dollars." Another way to look at it: "Home prices have increased 7.6x faster than income since 1965 and 3.1x faster than income since 2008, accounting for inflation."
We've known about this problem for a while, but it has kind of crept up on American families through the years. I sometimes put it this way: My parents bought the home I grew up in for less than $30,000, when my dad was earning about $10,000 a year. Easy math: How many places do you know where a teacher can earn $100,000 a year and find homes under $300,000? That historic 3 to 1 ratio or home price to annual salary has a nice ring to it, as it's similar to that "don't spend more than 30% of your monthly income on housing" rule that virtually everyone breaks now.
Whenever I bring this up, people who bought homes in the past often suggest young people today don't know how to scrimp and save, and that's why they are having trouble buying homes (the latte factor). Or, they suggest people are demanding much larger homes, and that's the problem. There's a bit of truth to this point, but as I've written before, nobody builds small starter homes anymore, and much of the aging 2-bedroom stock has been bought up by real estate investment companies and turned into rentals. Don't blame that on young families. When you are house hunting, you can only buy what's for sale.
Into this punishing math stepped the pandemic, which supercharged h0using prices and has made this problem even worse. Here's Clever again:
"From 2019 to 2021, the average house-price-to-income ratio increased from 4.7 to 5.4 — a 14.9% increase that’s more than double the recommended ratio of 2.6. In other words, homes cost 5.4x what the average person earns in one year."
So, if you have a good $100,000 job, expect to be out there looking for $540,000 homes.
All real estate is local, so these national numbers understate the problem for many people. In places like Los Angeles, San Francisco and New York, the ratio is more like 10 to 1. So, that well-off person with a six-figure income is looking at $1 million starter homes.
Maybe you expect that in American's most prominent cities. Remember, to comfortably afford a home, it's best to keep the price down below 3x annual income. And you can do that in places like Oklahoma City, St. Louis, and Cleveland, where the ratio of income to price is more like 2.5:1. But the list of such cities is short. Meanwhile, smaller cities saw unprecedented price increases during the pandemic as people fled the most crowded places. In Providence, Rhode Island, buyers now see 4.4:1 ratios; in Phoenix, it's 4.4:1. In Nashville, it's 3.9:1. Even in traditionally affordable Raleigh, it's 3.5:1.
In other words, the number of places where crazymaking math punishes young families is spreading across the country. You can see the list of less-affordable places at Clever. When I last charted America's Restless problem, I spent a lot of time charting "sane circles" where incomes and housing costs weren't out of line. Small cities provided an escape hatch for families who'd had enough of impossibly-priced housing on the coasts. I always knew that was a temporary solution. But now, hastened by the pandemic, this escape hatch is closing fast.
The pandemic has changed so much about American society. We will be analyzing the fallout for many decades. Much of the coronavirus-inspired change is welcome. Will workers ever tolerate 2.5-hour commutes again? I hope not. But we need to think hard about how the spread of Restless housing math is going to reshape America. Small, affordable cities provided hope to many young families, even those who never bailed on expensive coastal places. That hope is dimming and we need to do something about it. Something more than token construction of a few affordable housing units every decade or so.
Matt Yglesias has been on this for a long time. The main reason is that most cities make it really difficult to build more residential space. You live in DC. Remember how great the pushback was to the new development plan that leaned a bit toward reducing these restrictions?